The largest piece of customer research your business already owns.
Your customers have already explained why each branch or franchisee performs the way it does.
Most operating decisions get made in a room where the customer's voice is not present. Here it is, in their own words, compared branch by branch.Every Google review across a multi-site business is read and compared, then turned into a strategic plan across the estate with tactics for each branch.Why does one site outperform another? Where is the network quietly losing customers and money? What do your competitors keep getting wrong that you could take from them?The answers are already written down, except nobody has systematically compared them yet.
You know your branches perform differently. But do you know exactly why?
The ratings show you the score. The review text tells you why. Read one at a time, reviews are anecdotes. Compared side by side across every branch, they become evidence: the same praise recurring at one site, the same complaint recurring at another, and the operational reasons behind both.It does not stop at your own doors. Your competitors' customers have written the same record about them, including the things those rivals get wrong again and again. Where a competitor keeps failing at a predictable moment and your branches could do it better, that is an opening you can take.The work is not only counting. Numbers tell you a branch has slipped; the language tells you why. The reading looks for the words your customers choose, the moments they mention without being asked, the praise that appears at one site and nowhere else, and the things nobody says at all. That is where the specific, fixable differences live.The patterns are sitting in the review data and this report is the work of going and looking.
What you get: a bespoke intelligence report, built from every review across your network - and your competitors'
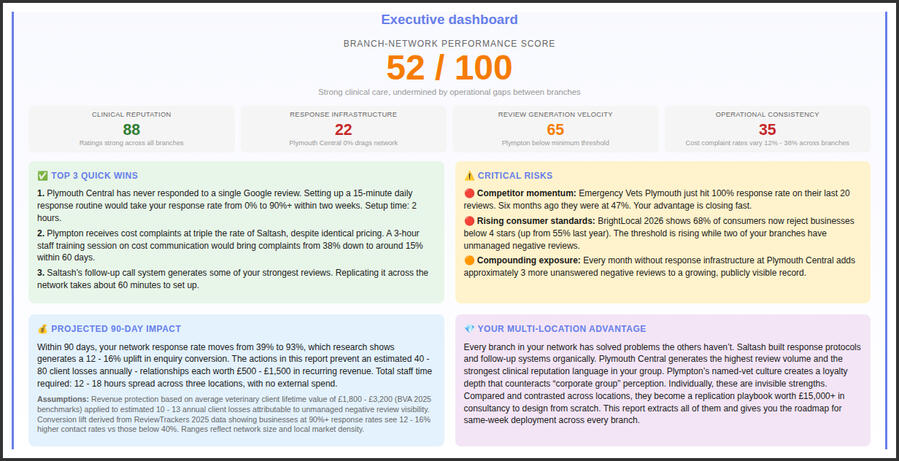
Executive Dashboard
Network health score, key findings, watchlist, and whole-of-network tables and insights. The page your leadership team reads first. If your network is grouped into regions, you will also receive a dashboard for each region.
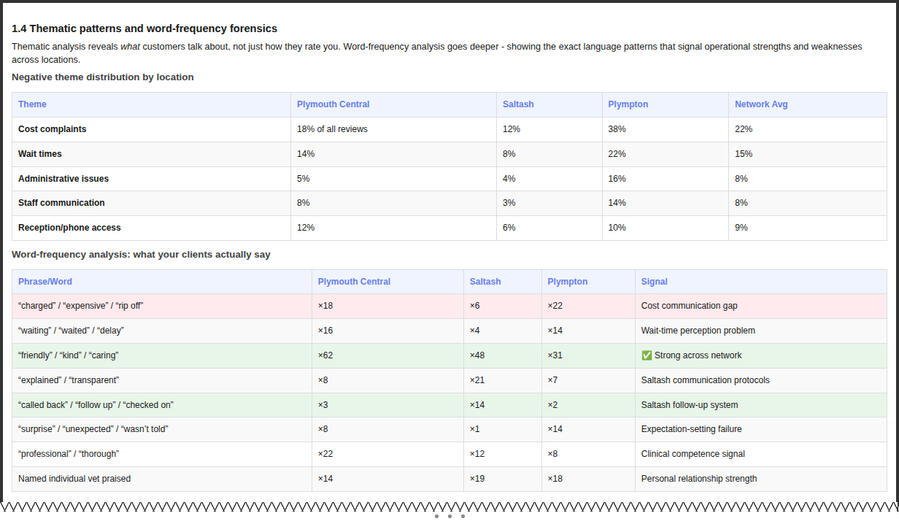
Diagnostic Analysis
Response rates, review trends, complaint themes, and branch-by-branch comparisons across every metric. What is happening at each location, quantified.
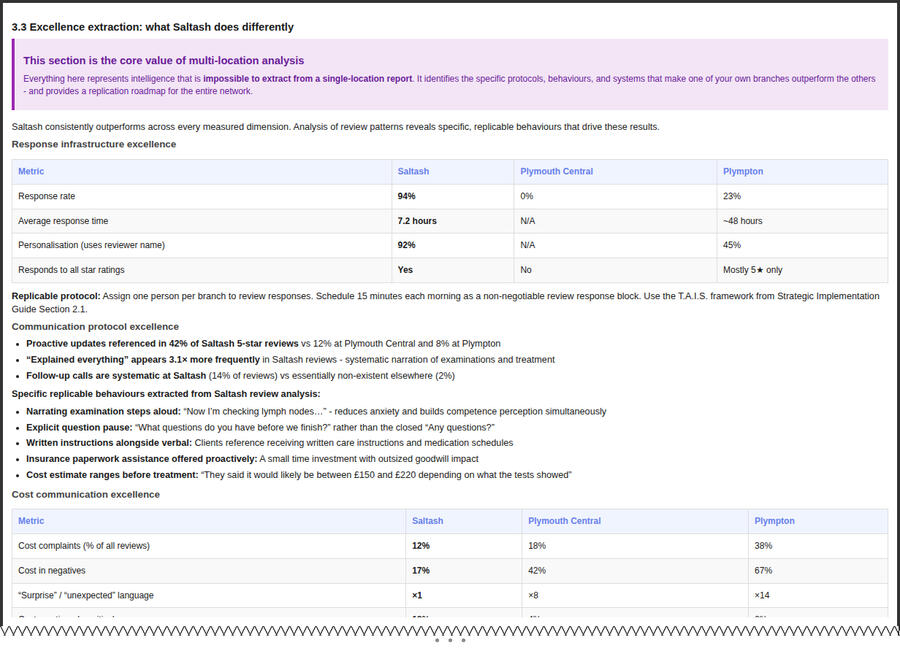
Excellence Extraction
Your best branch already knows how to get 5-star reviews. The others can learn. What each branch does differently. Specific habits extracted from the review text, with replication protocols. Every branch contributes something.
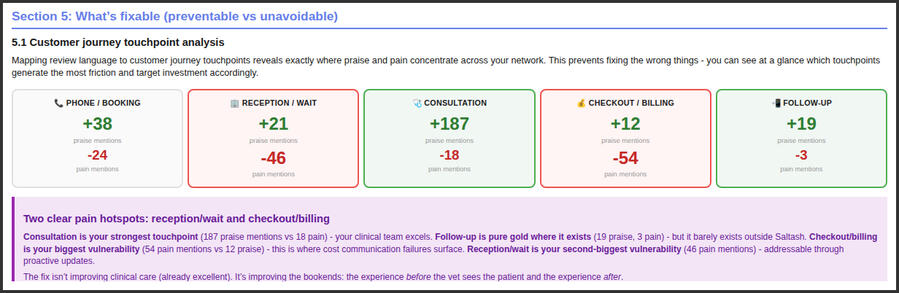
Customer Journey Mapping
Where praise and pain concentrate at each stage of the customer experience. Network-wide and per-branch breakdowns.
Financial Impact
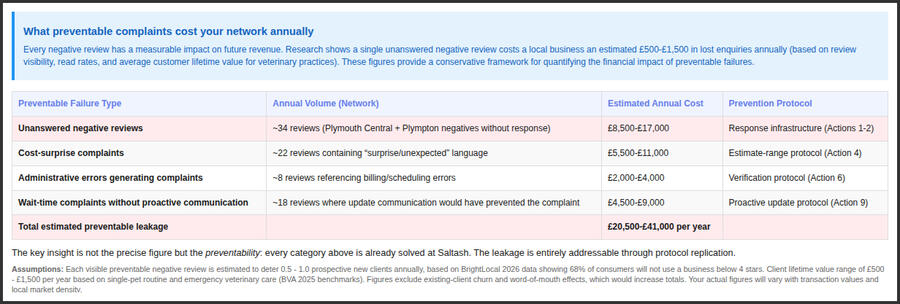
The estimated annual cost of preventable negative reviews, quantified with stated assumptions. Shows exactly where complaints concentrate and what fixing them is worth.
90-Day Action Plan
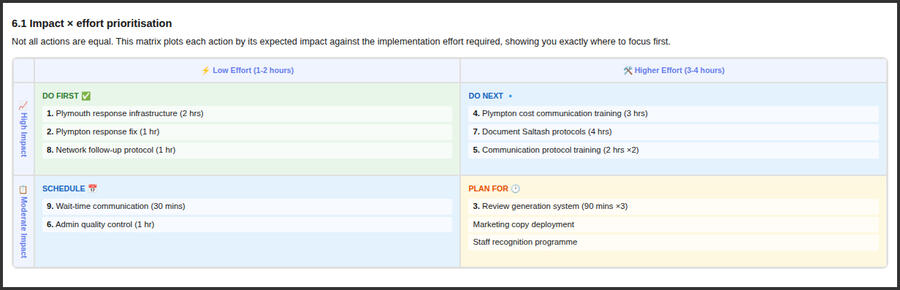
Prioritised by impact and effort. Specific actions, owners, time estimates. Cross-referenced to the Implementation Guide.
Every report also includes:
Competitive white space: the moments your closest rivals consistently get wrong, and where your branches are placed to claim them · Ready-to-use phrases direct from your happiest customers · Staff spotlight with key-person dependency assessment · Strategic Implementation Guide · A short intake once the assignment begins, so the analysis can more closely reflect what is actually happening in your network
Real examples from real networks
3-branch veterinary groupSame company, same services, same prices and yet three completely different customer experiences.The report found that one branch narrates costs before treatment, responds to every review within 7 hours, and makes follow-up calls after procedures. The other two don't.Those gaps cost the network an estimated £20,000–£40,000 per year in lost clients. The fixes required no budget, no new technology, and roughly 12–18 hours of staff time across 90 days.The top branch had already solved the problems the others were still generating. The fix was replication, not reinvention.
4-branch hospitality group + competitor benchmarkFour venues of a national leisure brand, benchmarked against a direct competitor in two cities.Google showed all four venues rated 4.8–4.9. The report uncovered a hidden trajectory problem: one venue's most recent reviews averaged 4.48 while the others held at 4.87–4.89. The venue's staff were the most praised in the entire network, but the systems around them were suffering from previously unseen issues.Benchmarking against the competitor did more than confirm the problems were fixable: it showed where the rival was slipping and the venue was placed to pull ahead. Within hours of receiving the report, the leadership team had already actioned two of the recommendations.
29-venue national leisure brandA network-wide analysis across 29 venues: an executive pack, five regional reports, and an individual scorecard for every site. Google showed venues rated consistently high, but the estate-level read surfaced insights invisible from any single location, including a competitive white-space position no operator in the category had yet claimed.
Sector Research
Alongside client work, Visible Edge analyses review data at sector scale. Current datasets cover more than 6,000 UK healthcare, hospitality and high-street businesses, with over 25,000 written reviews analysed. Findings from this work are prepared for the trade press.
Monitoring tools track your reviews. This one explains them.
Trackers show you numbers and trend lines. Useful for monitoring, but they only tell you WHAT is happening, not WHY, and not WHAT TO DO.This report reads every word your customers have written across every branch, identifies the specific operational patterns behind the numbers, and translates them into protocols your team can implement this week.I read your competitors' reviews as closely as your own, and look for the moments they consistently get wrong. Where a rival frustrates its customers at a predictable point and your sites can do it better, that is a position you can claim, not just a complaint you can rule out.The methodology has been developed across more than 6,000 UK businesses and 25,000 written reviews, spanning veterinary, optical, hospitality and high-street sectors. It handles the data sourcing, cross-branch calibration, competitor benchmarking, and translation into implementation protocols.
What it costs
Engagements start at £2,500 + VAT for a network of 3 to 8 sites. Nine or more is quoted bespoke, scoped to the requirements of your estate.Half invoiced at commencement, half before the report is released. Bank transfer or card.Allow up to three weeks from the first payment. Reading every review across a network, and its competitors', takes time. So does checking that what looks like a pattern actually is one. Anything that does not survive the testing is cut.If you do not find one insight that you did not already know and that is worth more to you than the fee, then full refund.Email [email protected] with your network size.
How it works
1. You state your sites, any internal/regional structure to report against and any competitors you specifically care about.2. Scope, timeline and price come back to you in writing.3. Accept, and the first half is invoiced. Work starts when it clears.4. Every review across your network, and your competitors', is read and the patterns tested.5. The report suite is ready within three weeks. The second half is invoiced, and the link goes live on payment, alongside a video walkthrough.
Particularly valuable if:· You suspect some branches do something right but cannot pinpoint what
· You want to systematise excellence rather than firefight problems
· Your branches have different ratings or review volumes
· Some branches get complaints that others do not
· You want actionable intelligence, not another dashboard
· You want to know where your competitors keep falling short, and which of those gaps you are best placed to take
Who's behind thisI am JP, an accountant with 25 years in industry. I started VisibleEdge after noticing that multi-location businesses were sitting on years of operational detail in their Google reviews and nobody was extracting it systematically.Every report uses the same methodology, developed across thousands of reviews in veterinary, optical, hospitality and high-street sectors, with a consistent production and quality-control pipeline behind it.All data is handled confidentially and used solely for your report.
Your customers see every franchisee every week, and they write down what they find.
You see each franchisee a few times a year. Their customers see them every day, and plenty of them say exactly what went right or wrong in a Google review.One at a time, those reviews are anecdotes. Compared across your whole network, they show which franchisees are slipping and why, and what your best ones do that the rest don't. That comparison is specialist work: every review coded the same way, every pattern tested, and every finding traced back to what the unit actually does differently.
Particularly valuable if· You only find out a franchisee is struggling once their royalties have already dropped
· Field visits go to the units you're already worried about, while others slip quietly between visits
· Your best franchisees clearly do something the others don't, but nobody has pinned down what it is
· A run of bad reviews at one unit damages the brand that every franchisee shares
· You want franchisees to feel supported, not just audited
· Prospective franchisees check your customer reviews before they decide to sign
How it worksEvery review across your network is coded, counted and compared, unit against unit and against your local rivals. Any pattern that doesn't hold up under testing is dropped before you see it.What's left becomes plain actions: what each franchisee should change, which habits from your best units are worth spreading, and what each recurring problem is likely costing you.
What you getFor each franchisee: a short, plain-English note on what their customers said, what they praised and the one thing worth doing next. Weekly where reviews allow, monthly where they're quieter. Written as support, so it gets read rather than resented. Each quarter, every franchisee also gets a one-page bulletin on what the whole network has learned: the habits behind the best results and the themes worth watching.For you: a monthly operations review with the network league table, the units on the move, what each recurring problem is costing and whether last month's fixes are working, so you know who needs a visit, and what to talk about, before the numbers tell you. Each quarter, a read on where the brand stands against its rivals and which standards are worth spreading.For recruitment: proof of what your customers think, in their own words, for the people deciding whether to join you.
Not another review dashboardReview tools show you the score. This explains it: what each unit does differently, why it matters to your customers, what to change first, and, month by month, whether the change worked.
Start with a free network snapshotBuilt from public reviews using the same coding and testing as the full service, so there's nothing to send and no access needed. Within a few days you'll see:· Your rating spread, unit by unit
· The three franchisees whose customers describe them most differently from the rest, and how
· What customers praise at your strongest units, written as habits the others can copy
· How many reviews your units receive each week, and what that means in practice
What it costsTwo things set the price: how many units you have, and how many reviews they receive, because that decides whether each franchisee's note is weekly or monthly. The free snapshot measures both, so your exact monthly quote comes in writing with it, with no obligation.Monthly by Direct Debit, cancel any time. If you go ahead, the invoice arrives the same day and work starts on payment.
Who's behind thisI'm JP, an accountant with 25 years in industry. I read and compare Google reviews across multi-site networks, using a methodology developed across more than 6,000 UK businesses and 25,000 written reviews.